
Search Results foriata
IATA: total global passenger demand up by over three percent in March
The International Air Transport Association (IATA) has issued its report on March 2025 global passenger demand for air travel. It was noted that total demand, as measured in revenue passenger kilometers (RPK), was up 3.3 percent compared to March 2024. Total capacity measured in available seat kilometers (ASK), on the other hand, increased by 5.3 percent year-on-year. Load factor hit 80.7 percent, a 1.6 ppt drop from March 2024. International demand rose 4.9 percent compared to March 2024, while capacity was up 7 percent year-on-year, and the load factor was 79.9 percent. With regard to domestic demand, the total was up by 0.9 percent compared to March of last year, and capacity increased by 2.5 percent year-on-year; load factor was at 82 percent. IATA director-general Willie Walsh pointed out: “A capacity expansion of 5.3%, however, outpaced the demand expansion leading to a load factor decline from record highs to 80.7% system-wide. There remains a lot of speculation around the potential impacts of tariffs and other economic headwinds on travel. While the small decline in demand in North America needs to be watched carefully, March numbers continued to show a global pattern of growth for air travel. That means the challenges associated with accommodating more people who need to travel, specifically alleviating supply chain problems and ensuring sufficient airport and air traffic management capacity, remain urgent.” Market performance in March 2025 International markets International RPK growth slowed to 4.9 percent in March year-on-year from the 5.9 percent reported for February and from the 12.5 percent reported in January. This slowdown since January reflects in large part the final normalization of year-on-year demand comparisons post-COVID. Asia-Pacific was the strongest performer among regions with 9.9 percent growth. On the other hand, load factors dropped in every region, reflecting a -1.7 ppt overall decline. Performance by region Asia-Pacific airlines reported a 9.9% year-on-year increase in demand. Capacity increased 11.6% year-on-year, and the load factor was 84.1% (-1.3 ppt compared to March 2024). European carriers had a 4.9% year-on-year increase in demand. Capacity increased 6.9% year-on-year, and the load factor was 78.2% (-1.5 ppt compared to March 2024). Middle Eastern carriers saw a -1.0% year-on-year decline in demand. Capacity increased 2.8% year-on-year, and the load factor was 74.6% (-2.9 ppt compared to March 2024). The decline in demand is likely related to the timing of Ramadan which impacts travel patterns. North American carriers saw a -0.1% year-on-year fall in demand. Capacity increased 2.0% year-on-year, and the load factor was 83.0% (-1.8 ppt compared to March 2024). While demand had a second consecutive month of year-on-year contraction, it is important to note that this is an improvement on the -1.5% decline reported for February. Latin American airlines saw a 7.7% year-on-year increase in demand. Capacity climbed 12.1% year-on-year. The load factor was 80.9% (-3.3 ppt compared to March 2024). African airlines saw a 3.3% year-on-year increase in demand. Capacity was up 3.5% year-on-year. The load factor was 70.1% (-0.2 ppt compared to March 2024). Domestic markets Domestic air travel posted a marginal gain of 0.9 percent, weighed down by declines in the US and Australian markets. Brazil and India reported the strongest growth at 8.9 percent and 11 percent respectively. Meanwhile, both Australia and the US reported slight declines, whilst the overall load factor fell -1.3 ppt as domestic capacity expanded 2.5 percent.
Asia-Pacific airlines saw 9.6% YOY demand growth for air cargo in March: IATA
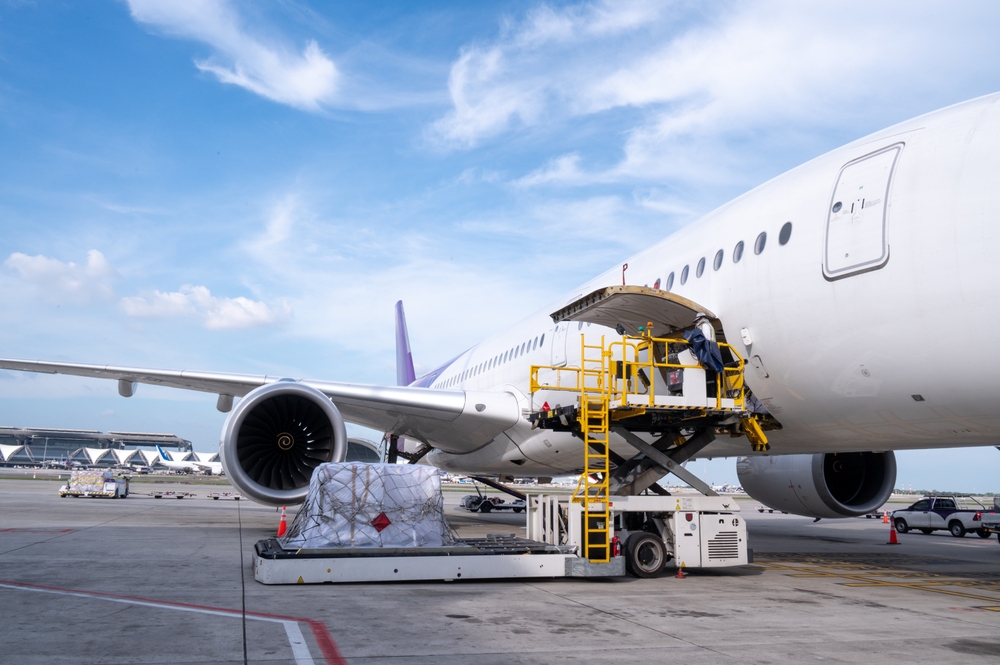
Representative Image The International Air Transport Association (IATA) released data for March 2025 global air cargo markets showing that the total demand, measured in cargo tonne-kilometers (CTK), increased by 4.4% compared to March 2024 levels (+5.5% for international operations), a historic peak for March. Capacity, measured in available cargo tonne-kilometers (ACTK), expanded by 4.3% compared to March 2024 (+6.1% for international operations). “March cargo volumes were strong. It is possible that this is partly a front-loading of demand as some businesses tried to beat the well-telegraphed 2 April tariff announcement by the Trump Administration. The uncertainty over how much of the 2 April proposals will be implemented may eventually weigh on trade. In the meantime, the lower fuel costs—which are also a result of the same uncertainty—are a short-term positive factor for air cargo. And, within the temporary pause on implementation we hope that political leaders will be able to shift trade tensions to reliable agreements that can restore confidence in global supply chains,” said Willie Walsh, IATA’s Director General. Several factors in the operating environment should be noted: March volumes typically rise after a lull in February, and this single-digit increase is in line with pre-COVID growth trends. Jet fuel prices dropped 17.3% year-on-year, marking nine straight months of year-on-year declines. The sharp rise in US tariffs and new trade rules, especially the 2 May ban on duty-free imports from China and Hong Kong, may have prompted companies and buyers to make purchases in advance to avoid significant import fees. World industrial output grew 3.2% year-on-year, and trade volumes expanded 2.9%. Many key Consumer Price Inflation (CPI) indices fell: US inflation was 2.4%, down 0.4 points from February, EU CPI was 2.5% and Japan’s rate fell 0.1% to 3.6%. China remains in deflation but this eased to -0.1%. Air cargo market in detail - March 2025 World March 2025 (% year-on-year) share1 CTK ACTK CLF (%-pt) CLF (level) TOTAL MARKET 100.0% 4.4% 4.3% 0.0% 47.5% Africa 2.0% -13.4% 10.8% -10.4% 37.1% Asia Pacific 34.2% 9.3% 7.6% 0.8% 48.6% Europe 21.5% 4.4% 2.8% 0.9% 59.6% Latin America 2.9% 5.6% 5.2% 0.1% 39.5% Middle East 13.6% -3.3% 0.9% -2.0% 47.6% North America 25.8% 3.7% 2.6% 0.5% 40.7% Note 1: % of industry CTK in 2024 March Regional Performance Asia-Pacific airlines saw 9.6% year-on-year demand growth for air cargo in March, the strongest growth among the regions. Capacity increased by 11.3% year-on-year. North American carriers saw a 9.5% year-on-year increase in demand growth for air cargo in March. Capacity increased by 6.1% year-on-year. European carriers saw a 4.5% year-on-year increase in demand growth for air cargo in March. Capacity increased 2.0% year-on-year. Middle Eastern carriers saw a -3.2% year-on-year decrease in demand growth for air cargo in March. Capacity increased by 0.8% year-on-year. It’s possible the weakness in this market is due to year-on-year comparison with the strong growth at the start of 2024 resulting from disruption to Red Sea maritime freight. Latin American carriers saw 5.8% year-on-year demand growth for air cargo in March. Capacity increased 4.7% year-on-year. African airlines saw a -13.4% year-on-year decrease in demand for air cargo in March, the slowest among the regions. Capacity increased by 10.5% year-on-year. Trade Lane Growth: The Europe-North America route was the busiest trade lane in March. The largest trade lane by market share, Asia-North America, also grew strongly, possibly encouraged by front-loading shipments ahead of potential increased tariffs. Europe-Middle East and Africa-Asia were the only trade lanes to decline in March. Trade Lane YOY Growth Notes Market Share of Industry Asia-North America +7.3% This route has resumed growth after a revised fall of 0.5% in February 24.4% Europe-Asia +8.3% 25 consecutive months of growth 20.5% Europe-Middle East -7.5% N/A 5.7% Middle East-Asia +2.9% N/A 7.3% Within Asia +5.5% 17 consecutive months of growth 7.0% Europe-North America +8.5% 14 consecutive months of growth 13.3% Africa-Asia -40.2% 4 consecutive months of decline 1.4% Within Europe -5.2% N/A 2.0%
IATA: global air cargo demand up 4.4 percent in March
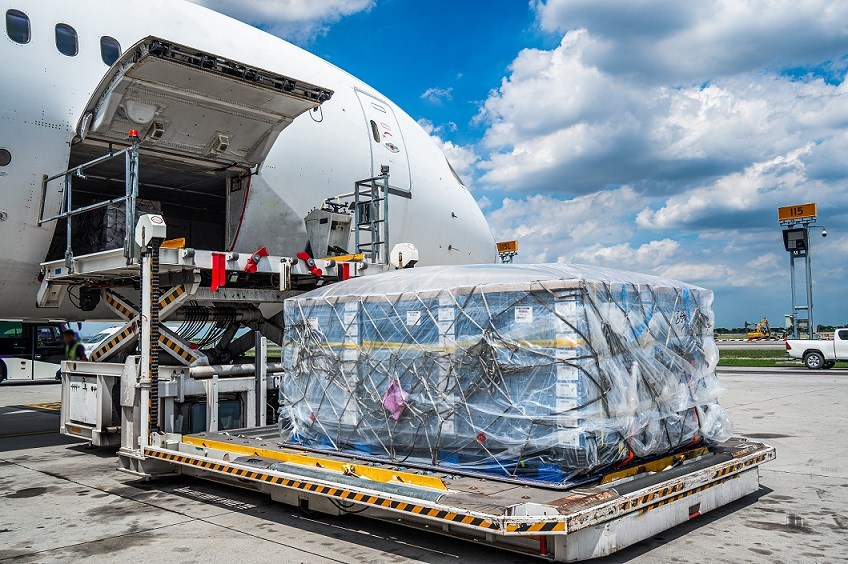
The International Air Transport Association (IATA) released data for March 2025 global air cargo markets on Tuesday, 29th April. The latest report shows that total demand, measured in cargo tonne-kilometers (CTK), rose by 4.4 percent compared to the total reported in March 2024. The March 2025 result was also noted as a historic peak for March in the global air cargo sector. At the same time, capacity, as measured in available cargo tonne-kilometers (ACTK), expanded by 4.3 percent compared to the same month last year. IATA director-general Willie Walsh said: “March cargo volumes were strong. It is possible that this is partly a front-loading of demand as some businesses tried to beat the well-telegraphed 2nd April tariff announcement by the Trump Administration. The uncertainty over how much of the 2nd April proposals will be implemented may eventually weigh on trade.” Walsh further pointed out that, for now, lower fuel costs which were driven by the same uncertainty are to be construed as a short-term positive factor for air cargo. Walsh added: “Within the temporary pause on implementation we hope that political leaders will be able to shift trade tensions to reliable agreements that can restore confidence in global supply chains.” Factors to consider Several factors in the operating environment should be noted; these include: March volumes typically rise after a lull in February, and this single-digit increase is in line with pre-COVID growth trends. Jet fuel prices dropped 17.3 percent year-on-year, marking nine straight months of year-on-year declines. The sharp rise in US tariffs and new trade rules, especially the ban on duty-free imports from China and Hong Kong beginning 2nd May, may have prompted companies and buyers to make purchases in advance to avoid significant import fees. World industrial output grew 3.2 percent year-on-year, and trade volumes expanded 2.9 percent. Many key Consumer Price Inflation (CPI) indices fell: US inflation was 2.4%, down 0.4 points from February, EU CPI was 2.5 percent and Japan’s rate fell to 3.6 percent. China remains in deflation but this eased to -0.1 percent. Global performance per region for March 2025 Asia-Pacific airlines saw 9.6 percent year-on-year demand growth for air cargo in March, the strongest growth among the regions. Capacity increased by 11.3 percent year-on-year. North American carriers saw a 9.5 percent year-on-year increase in demand growth for air cargo in March. Capacity increased by 6.1 percent year-on-year. European carriers saw a 4.5 percent year-on-year increase in demand growth for air cargo in March. Capacity increased 2 percent year-on-year. Middle Eastern carriers saw a -3.2 percent year-on-year decrease in demand growth for air cargo in March. Capacity increased by 0.8 percent year-on-year. It’s possible the weakness in this market is due to year-on-year comparison with the strong growth at the start of 2024 resulting from disruption to Red Sea maritime freight. Latin American carriers saw 5.8 percent year-on-year demand growth for air cargo in March. Capacity increased 4.7 percent year-on-year. African airlines saw a -13.4 percent year-on-year decrease in demand for air cargo in March, the slowest among the regions. Capacity increased by 10.5 percent year-on-year. With regard to trade lane growth, the Europe-North America route was the busiest trade lane in March. The largest trade lane by market share, Asia-North America, also grew strongly, possibly encouraged by front-loading shipments ahead of potential increased tariffs. Europe-Middle East and Africa-Asia were the only trade lanes to decline in March.
IATA CEIV Programme marks its tenth anniversary
The International Air Transport Association (IATA) recently marked ten years of its Center of Excellence for Independent Validators (CEIV) programme, which continues to improve the air cargo supply chain’s performance on quality, safety, and compliance. Launched in 2014 with CEIV Pharma to support the handling of specialized cargo, CEIV provides industry-wide certification programmes covering pharmaceuticals (CEIV Pharma), live animals (CEIV Live Animals), perishables (CEIV Fresh), and dangerous goods (CEIV Lithium Batteries). These programmes are built on the foundation of global standards and independent validation, enabling greater transparency and operational consistency. A decade marked by achievements Since, its initial rollout, CEIV has: Established a global footprint of 699 companies, including 85 airlines and covering 250,000 trade lanes; Created 25 airport communities of airlines, ground handlers, freight forwarders, and regulators committed to global best practices; Trained 10,000 professionals and is supporting them with over 100,000 IATA manuals to deliver operational excellence and compliance; and Proved its worth with a 99 percent renewal rate. IATA global head of cargo Brendan Sullivan said of the programme: “CEIV has redefined the handling of special cargo shipments. Over the past decade, it has established a foundation of trust, transparency, and technical excellence across the supply chain—delivering tangible industry benefits, including improved compliance, a stronger culture of quality, enhanced cross-industry collaboration, and increased customer confidence. As the program continues to grow, it will remain a vital tool in helping the industry meet evolving challenges and expectations.” Moving into the future of certification CEIV continues to evolve in line with industry needs. New technologies now enable remote training and virtual assessments, improving accessibility without compromising quality. IATA is working closely with regulatory authorities to increase recognition of CEIV certifications and expand the program’s reach into additional cargo segments. Sullivan added: “As global supply chains become more complex, the need for consistent, trusted standards is greater than ever. CEIV will continue to support innovation, strengthen compliance, and enhance safety across the air cargo ecosystem.” CEIV-certified companies can be found through IATA’s ONE Source platform, the industry’s reference for validated suppliers.

IATA cites importance of air cargo in global supply chain resilience
The International Air Transport Association (IATA) emphasised the vital role of air cargo in maintaining global supply chain resilience at the opening of its 18th World Cargo Symposium (WCS) today in Dubai, UAE. The Association called on governments and industry to remain focused on delivering the fundamental expectations of customers; namely safety and security, digitalization and sustainability. In his opening remarks, IATA global head of cargo Brendan Sullivan declared: “Whether supporting global trade, enabling e-commerce, or delivering vital humanitarian aid, the value of air cargo has never been clearer. To meet customer expectations and navigate an increasingly complex environment, the air cargo industry must continuously strengthen safety and security, fast-track digitalization, and deliver on its sustainability commitments.” Safety calls for a zero-tolerance policy for rogue shippers Safety is the top priority for air transport and in the case of air cargo the specific focus is on the safe transport of lithium batteries. Thus, IATA calls on governments to step up efforts to stop rogue shippers and support ICAO’s work to strengthen Annex 18 of the Chicago Convention, the global framework for the safe transport of dangerous goods by air. Sullivan said of this: “Shipments of lithium batteries are growing in volume. With that come increased risks associated with undeclared or mis-declared goods. The industry has invested in training, certification, and technology. Governments must match that commitment with robust oversight and enforcement.” Coordinated, risk-based measures are needed to boost security IATA reinforced calls to governments for a coordinated, risk-based approach to air cargo security following recent incidents involving incendiary devices concealed in shipments. While some states implemented new measures, the lack of alignment led to inconsistent outcomes. This situation reinforces the importance of harmonized responses based on global standards. Sullivan opined: “Recent security incidents highlight the need for better coordination among governments. Aviation security cannot be built on fragmented or reactionary measures. Global standards and cooperation are essential.” IATA also renewed its call to states to fulfill their Annex 17 obligations by sharing timely and accurate threat intelligence to enable informed risk assessments and operational decisions. Sullivan added: “The industry is best placed to understand its operations and the associated safety and security risks. But governments have infinitely more resources, particularly in intelligence gathering. The best results come when governments and industry work together.” Fast-tracking the adoption of ONE Record throughout the industry IATA reinforced the central role of ONE Record as the industry’s standard for end-to-end digital data exchange, supporting improved efficiency, compliance, and transparency. The industry’s goal is clear: by January 2026, ONE Record will become the preferred method of sharing data. To accelerate industry adoption IATA urged: Airlines and forwarders to move forward with implementation Governments to recognize ONE Record in regulatory data filing requirements Developers to build secure, open, and compatible digital platforms Sullivan said: “ONE Record is a foundational shift in how we share, manage, and trust data across the supply chain. Airlines representing 72 percent of global air waybill volume are on track to implement it. More than 100 IT providers and 10,000 freight forwarders are already aligned. To achieve full value, implementation must accelerate across all stakeholders, and governments must recognize ONE Record in their regulatory frameworks. SAF support and strong commitment are keys to sustainability The air cargo industry continues to embed sustainability into its operations, with growing efforts to reduce waste, implement circular practices, and phase out single-use plastics. For example, IATA guidance to eliminate single-use plastics across the cargo supply chain is now reflected in operational standards. Progress is also being made on the sector’s largest environmental challenge: reducing carbon emissions. Momentum around Sustainable Aviation Fuel (SAF) is growing, with new agreements across the value chain and more companies committing to SAF use. The SAF Registry, recently launched and operated by CADO, is designed to enable a global market for Sustainable Aviation Fuel (SAF) and accelerate the industry's transition to net-zero emissions by 2050. In addition, IATA will soon launch CO2 Connect for Cargo to support accurate emissions calculation and reporting, including SAF usage. However, SAF volumes remain far below what is needed, and production costs remain high. IATA urged governments to implement policy frameworks to scale up SAF production and reduce costs. Sullivan declared: “We are committed to net zero carbon emissions by 2050. But the ramp-up of SAF, our strongest lever, has been disappointing. The major fuel producers have been sidelining planned investments in SAF. Aircraft manufacturers have backed off their commitments for medium-term delivery of CO2 saving products such as hydrogen-powered aircraft. And governments have not provided the policy support needed, even though they have a playbook at hand with how the wind and solar energy industries expanded. Instead, they send mixed signals by subsidizing fossil fuel extraction while aiming for net zero. Airlines are committed and determined but we cannot do it alone. We need action behind the words of regulators, fuel suppliers and manufacturers. Likewise, despite growing trade tensions, IATA reinforced its position that trade drives prosperity, and that any measures undermining the free flow of goods ultimately hurt businesses, consumers, and economies. As Sullivan puts it: “Current trade tensions are deeply concerning. Trade drives prosperity. The more the world trades, the better off we all are. So, whatever the resolution of current trade tensions is, we know that air cargo will be there to deliver the goods people need and want.”

IATA releases its Contactless Travel Directory
The International Air Transport Association (IATA) announced the release of its Contactless Travel Directory on Monday, 7th April. The Contactless Travel Directory was developed to quickly scale and increase adoption of contactless travel solutions for both airports and airlines. That said, the Directory will power a matchmaking service to help airlines identify and offer contactless travel at specific airports, including with their partner airlines. Contactless travel uses interoperable biometric solutions to enable travelers to move through the travel process without relying on paper documentation such as passports or boarding passes. Parts of the travel process that could be made more efficient with contactless travel include bag drop, lounge access, security access, security screening, and boarding. Making things easier According to IATA senior vice-president for operations, safety, and security Nick Careen: “The release of the Contactless Travel Directory will make it easier for airlines to expand biometric service opportunities for their customers. As travelers expect ever greater efficiency, biometric recognition technology is taking on a growing role in facilitating travel.” Careen added that, together with the IATA One ID initiative, the Directory will help accelerate this most necessary transition thanks to critical data and compliance with global standards. Digital services provider Airware, together with identity management providers IDEMIA and iPassport, will be the first to demonstrate the use of the Directory. At this year’s Passenger Terminal Expo, scheduled for this week in Madrid, delegates will be able to enroll during check-in for fictitious flights between the UK and Spain using the WorldJet Airline App, then pass through the biometric touchpoints at both Airware’s and IDEMIA’s booths, as one would in a real airport. Key features of the Contactless Travel Directory A single reference point for airlines to determine the availability of biometric travel touchpoints across their network. Traveler eligibility information by location, so airlines know which travelers (nationality, passport compatibility, and age) will be eligible for contactless services using biometric identification. Technical protocols airlines need to connect with other airline or airport biometric touchpoints.

IATA officially launches its Sustainable Aviation Fuel Registry
The International Air Transport Association (IATA) officially launched the Sustainable Aviation Fuel (SAF) Registry with its release to the Civil Aviation Decarbonization Organization (CADO). The Registry, now live under CADO management, will enable a global market for SAF that will accelerate the transition to net zero emissions by 2050. In a statement, IATA officials pointed out that the decarbonisation of the global aviation sector requires collective effort. They said: “In releasing the SAF Registry to CADO for launch, we have put in place a critical platform for the benefit of all stakeholders. It ensures that all airlines in the world have access to SAF and that their SAF purchases can be claimed against any climate-related obligations in this domain. The Registry will record the environmental attributes of SAF purchases in an immutable way, safeguarding against double counting. Airlines, their corporate customers, fuel producers, regulatory bodies, and all related organizations will be able to record and account for their SAF transactions in a global market for SAF.” Officials added that, while this is of fundamental importance and a historically momentous advance, it is but one step along the way to a mature, transparent, and liquid global SAF market. Further progress requires active policy support for the ramping-up of all renewable energy production, and for SAF within that production. According to IATA senior vice-president for sustainability and chief economist Marie Owens Thomsen: “Governments must reallocate their direct support given to fossil fuel producers in favor of renewable energy production. The precedent of the wind and solar energy markets is the example to follow, and this without any further delay.” What exactly is the SAF Registry? The SAF Registry is a global system to record SAF transactions in a standardized and transparent way. It ensures that the environmental benefits of SAF can be tracked as they move across the SAF value chain and enable the claiming of these against regulatory obligations and voluntary schemes by airlines and corporate customers. The Registry helps solve the challenge of limited SAF supply which is acutely scarce and available in only a few locations globally by connecting airlines with SAF producers and suppliers, regardless of their geographical location. In addition, it gives airlines’ corporate customers access to in-sector emissions reductions and capitalizes on firms’ capacity to co-finance the cost of decarbonisation. The SAF Registry is technology and feedstock neutral, favouring the emergence of diverse SAF production streams across the world. It will be able to accommodate specific regulations, while favoring global harmonisation. Moreover, interoperability with other registries is an important feature of the Registry, supporting competition and open markets. The Registry was developed in consultation with airlines, government authorities, OEMs, fuel producers and suppliers, and corporate travel management companies. With over 30 early users already in the process of onboarding and ready to use the system, the Registry is underpinned by the IATA SAF Accounting and Reporting Methodology which provides a consistent approach to accounting for the environmental benefits of SAF purchases, regardless of location.

IATA calls for changes to NZ Economic Regulatory Framework for Airports
The International Air Transport Association (IATA) called for urgent changes to New Zealand’s Economic Regulatory Framework for Airports. IATA’s call comes in the wake of the recent publication of the New Zealand Commerce Commission’s review of Auckland Airport’s Price Setting Event 4. IATA’s ad interim regional vice-president for North Asia and the Asia Pacific Dr Xie Xingquan said: “It is not surprising that the Commerce Commission has concluded that Auckland Airport’s charges are excessive in the range of NZ$150 million to NZ$226 million. While the airport has responded by lowering its charges over the next two years in response to the review, the process does highlight that the economic regulatory framework in its current form is not fit-for-purpose and change is urgently needed.” Concerns to take into consideration IATA pointed out that the current light-touch regulatory approach means Auckland Airport can set the aeronautical pricing as they wish. Auckland Airport, being the sole monopoly provider, can game the regulatory process by setting their pricing artificially high at the start of the regulatory process, and then respond, if they so wish, by lowering their pricing following the conclusion by the regulator or to ignore the report. While Auckland Airport is investing significantly in infrastructure, there are outstanding concerns highlighted by airlines about the size, phasing, cost allocation and affordability of these major investments. Experts note that some of these costs could have been avoided if infrastructure planning and investments had been managed appropriately in the past. Also, non-aeronautical activities, which generally draw much higher returns, are excluded from the purview of the Commerce Commission. According to Xie: “Aviation is a key economic sector for New Zealand, supporting 5.6 percent of the country’s GDP and 177,000 jobs. The delivery of demand driven, functional and cost-effective infrastructure will support the continued development of New Zealand’s aviation sector. The current consultation process with Auckland Airport is ineffective and may not deliver outcomes that are in the best interests of passengers. This needs to change.”

Passenger Demand Growth, especially domestic slows slightly in February 2025: IATA
Representative Image The International Air Transport Association (IATA) released data for February 2025 global passenger demand. Total demand, measured in revenue passenger kilometers (RPK), was up 2.6% compared to February 2024. Total capacity, measured in available seat kilometers (ASK), was up 2.0% year on-year. The February load factor was 81.1% (+0.4 ppt compared to February 2024). International demand rose 5.6% compared to February 2024. Capacity was up 4.5% year on-year, and the load factor was 80.2% (+0.9 ppt compared to February 2024). Domestic demand fell 1.9% compared to February 2024. Capacity was down 1.7% year-on year. The load factor was 82.6% (-0.2 ppt compared to February 2024). “While traffic growth slowed in February, much of this can be explained by factors including the leap year, and lunar new year falling in January compared to February last year. February traffic hit an all time high, and the number of scheduled flights is set to continue increasing in March and April. But we need to keep a close eye on developments in North America, which saw falls in both domestic and international traffic,” said Willie Walsh, IATA’s Director General. “The recent shut-down of Heathrow reminded us once again that the current passenger rights regime in place in Europe and the UK is not fit for purpose. The annual costs of compensation, care and assistance run into the billions. Thankfully, the Polish Presidency of the EU has recognized that this is a drag on European competitiveness and is progressing much-needed and long-anticipated reforms to EU261. While many of the proposed reforms are sensible, the package stops short of a real solution. Even with the reforms, EU261 will still target the airlines with penalties even if the root cause of delays is an infrastructure incident out of their control—like we saw at Heathrow. Over two decades of EU261 have not seen a reduction in delays because infrastructure providers have no incentive to improve their game. Sadly for European travelers, we are likely to see this play out again in this summer’s peak travel season. Genuine reform of EU261 must ensure that all parties responsible for delays have a stake in the consequences,” said Walsh. Regional Breakdown - International Passenger Markets International RPK growth moderated to 5.6% in February year-on-year, down from 12.3% growth in January. However, this growth meant that all regions except North America established record February levels of demand. Asia-Pacific airlines achieved a 9.5% year-on-year increase in demand. Capacity increased 8.3% year-on-year and the load factor was 85.7% (+0.9 ppt compared to February 2024). European carriers had a 5.7% year-on-year increase in demand. Capacity increased 4.9% year-on year, and the load factor was 75.5% (+0.5 ppt compared to February 2024). Middle Eastern carriers saw a 3.1% year-on-year increase in demand. Capacity increased 1.3% year-on-year and the load factor was 81.9% (+1.4 ppt compared to February 2024). North American carriers saw a -1.5% year-on-year fall in demand. Capacity decreased -3.2% year on-year, and the load factor was 78.9% (+1.3 ppt compared to February 2024). Latin American airlines saw a 6.7% year-on-year increase in demand. Capacity climbed 9.9% year on-year. The load factor was 81.7% (-2.5 ppt compared to February 2024). African airlines saw a 6.7% year-on-year increase in demand. Capacity was up 4.0% year-on-year. The load factor rose to 75.3% (+2.0 ppt compared to February 2024). Domestic Passenger Markets Domestic RPK fell -1.9% over the previous February. Load factors were almost flat (-0.2 ppt). Traffic decline in China (-3.2%) was likely due to Lunar New Year falling in January this year compared to February 2024. Falling US consumer confidence may well have contributed to the -4.2% decline in domestic US traffic. India continued to see strong demand (+13.2%) with the load factor at 90.3% (+1.4 ppt compared to February 2024).

IATA: air cargo demand slightly lower in February 2025
The International Air Transport Association (IATA) released its global air cargo market figures for February 2025 global air cargo markets. The report showed how total demand, measured in cargo tonne-kilometers (CTK), declined by 0.1 percent compared to February 2024 levels, marking the first decline since mid-2023. Consequently, capacity, measured in available cargo tonne-kilometers (ACTK), decreased by 0.4 percent compared to February 2024. IATA director-general Willie Walsh said: “February saw a small contraction in air cargo demand, the first year-on-year decline since mid-2023. Much of this is explained by February 2024 being extraordinary: a leap year that was also boosted by Chinese New Year traffic, sea lane closures and a boom in e-commerce. Rising trade tensions are, of course, a concern for air cargo. With equity markets already showing their discomfort, we urge governments to focus on dialogue over tariffs.” Mitigating factors In order to understand why cargo figures declined in the second month of the year, it should be noted that there was a 3.2 percent year-on-year increase in the industrial production index in January, registering the highest growth in two years. As world trade expanded by five percent, the cost of jet fuel prices likewise averaged $94.6 a barrel in February, 2.1 lower than it was the month before. In February, the Purchasing Managers Index (PMI) for global manufacturing output showed growth as it was above the 50-mark at 51.5. The PMI for new export orders rose slightly to 49.60 from the previous month, remaining just shy of the 50-mark, which is the growth threshold. However, consumer inflation remained elevated in the US, Europe, and Japan, easing only slightly from the previous month. In contrast, China recorded its first decline in consumer prices in 11 months, reinforcing signs of persistent deflationary pressure in the economy.

No Event found matching your search.
Return To Home